
The north-south house price divide may be narrowing, eXp UK claims.
Research by the self-employed agency brand has found that while the traditional gap between house prices in the north and south of England remains considerable, it has started to close. This is attributed to higher rates of house price growth seen across the north during the pandemic property market boom, as well as growing market sentiment as a result of the Government’s levelling up funds.
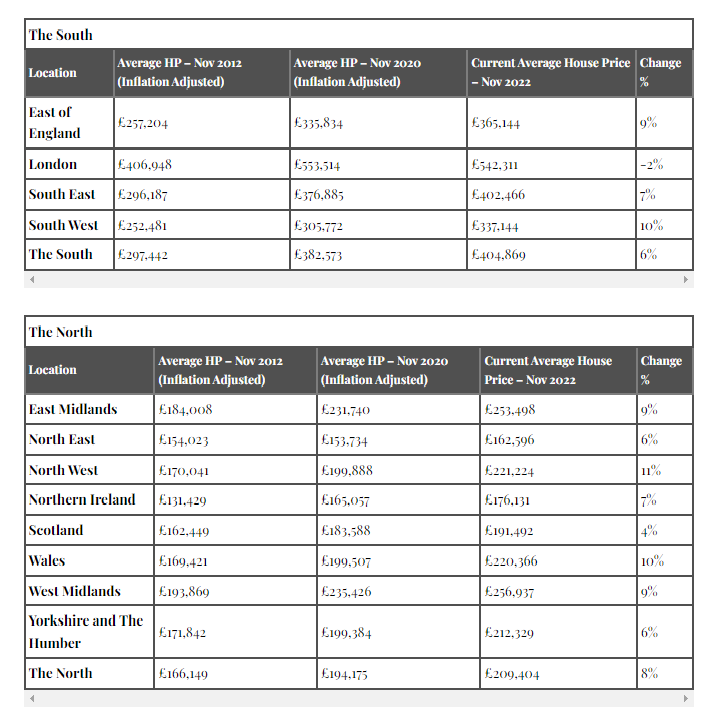
The brand’s research shows there remains a clear divide, with the average house price across the south of England currently sitting at £404,869. In contrast, the average house price across the north of England is currently £209,404.
Based on these property market parameters, the research by eXp UK shows that the North-South divide in property values remains a notable 93.3%. After adjusting historic house price data for inflation, the research also shows that this gap has widened from 79% a decade ago.
However, the gap has started to close, albeit marginally.
Since November 2020, when the Government first announced plans to launch the Levelling Up Fund and when the property market was benefitting from a pandemic house price boom, the North-South house price divide had climbed to 97%. Since then, house prices in the north have increased by an average of 8% after adjusting for inflation, driven by the North West and Wales 10%. In comparison, house price growth across the south has averaged 6%, with the South West seeing the highest rate of growth at 10%, while London trails within the south with a 2% decline.
This stronger performance across the North has reduced the gap from 97% to 93.3% over the past two years.
Adam Day, head of eXp UK, said: “It remains a tale of two markets across the UK property sector, with the south remaining the dominant force in terms of overall house price pedigree, while the north has enjoyed a stronger performance of late where house price appreciation is concerned. There’s no doubt that a heightened level of pandemic property market activity has helped drive market performance in the north, but the government’s plans to boost economic prosperity in northern regions via the launch of the Levelling Up Fund has also contributed to a more buoyant degree of market sentiment. While it’s still very early days in terms of money actually spent, the ongoing regeneration and investment of the north should help to further close the north-south divide going forward. Although with the gap remaining vast, it’s unlikely to tip the scales completely in the opposite direction.”
– House price data sourced from the Gov – UK House Price Index (November 2022 – latest available)
– Year on year look based on November house price data for each year and also to coincide with the government’s announcement of the Levelling Up Fund in November 2020.
– Historic house price data adjusted for inflation based on historic inflation rates from the Bank of England
Estate agents property for sale grows but sellers must adjust expectations – Zoopla
Agents are seeing more stock coming to the market but Zoopla is warning about seller expectations. The latest Zoopla House Price Index for January suggests the “scarcity of supply in the market is reversing,” with the average estate agent now listing 23 properties for sale – up from a low of just 14 homes in early 2022. Zoopla said a key risk to overall sales volumes for 2023 is unrealistic seller expectations.
It said: “Serious sellers will need to ensure their home is competitively priced in order to secure a sale – however as the majority of homeowners have made sizeable gains in their home value over the pandemic, there is more room for realism on pricing.”
The report also highlights that the discounts to asking prices to achieve a sale widened quickly at the end of 2022 but said this gap is now holding at 3% to 4% and there is no sign of this worsening at this stage. Zoopla said: “This is important because if this gap widens, sellers will feel under increasing pressure to reduce asking prices putting further downward pressure on headline prices. Additional modest price reductions are likely over the first quarter of 2023 as sellers continue to adjust asking prices in line with what buyers are prepared to pay.”
Zoopla’s data shows demand is up 10% on 2019 levels but remains 23% below the five-year average, while sales agreed are down 43%. Buyers are also shifting their preference towards flats, particularly in markets adjacent to big cities, Zoopla said.
More than a quarter of new buyers are now looking for one and two-bed flats, up 5% annually. In contrast, the share of demand for three-bed houses has fallen five percentage points to 39%, although they are still the most in-demand homes across the UK. Overall, the index recorded that house price growth slowed to 6.5% in 2022 from 8.3% at the end of 2021, with average prices ending the year at £261,200.
Richard Donnell, executive director at Zoopla, said: “The first few weeks of the year have got off to a stronger start than might have been expected given how market activity stalled at the end of 2022. There has been a clear shift towards flats as the early buyers focus on value for money and adjust expectations given the hit to buying power from higher mortgage rates. A proportion of existing homeowners are holding back waiting to see if sizable price falls materialise and how far mortgage rates fall back before entering the market. We believe demand for homes has room to improve further in the coming weeks. Anyone serious about selling needs to be realistic on the asking price and needs to ensure this is in line with what buyers are prepared to pay."
Second home and buy-to-let sales surge by a ⅕
Sales of second homes and buy-to-lets surged by 20% last year, fuelled by a boom in staycations and the stamp duty holiday. An extra 46,900 of these homes were sold in 2021-22, the last tax year, taking the total to 284,100, according to data released by HM Revenue and Customs.
Second homes and buy-to-lets accounted for a quarter of residential property sales and 45% of the Treasury’s stamp duty receipts. Buyers of these properties must pay a three percentage point surcharge on top of their stamp duty bill. The amount of extra tax paid by second homeowners and buy-to-let landlords rose by 35%, or £1.2bn, to £4.6bn.
Stamp duty receipts for all residential properties jumped by 69% between the 2020/21 and 2021/22 financial years, from £6bn to £10.2bn, according to HMRC. Properties worth above £2m and below £250,000 were the most popular among those buying additional homes, HMRC found. More than half (57%) of second homes were purchased for less than £250,000.
Neal Hudson, of the analyst BuiltPlace, said, "the surge in second home and buy-to-let sales was driven by the stamp duty holiday that was in effect in 2020 and 2021, and which helped push house prices to a record high. The tax break, which initially raised the nil-rate stamp duty band in England and Northern Ireland from £125,000 to £500,000, was in place between July 2020 and June 2021. Those buying additional properties still had to pay the surcharge on the first £500,000 of a property’s price, but their tax savings were considerable compared with before the pandemic. From July to September 2021, there was a three-month taper period, in which the nil-rate band came down to £250,000. HMRC’s data, which covers April 2021 to March 2022, reflects a rush of second home buyers and buy-to-let investors buying properties before taxes went up. A lot of them viewed it as an optimum time to save money.” He added that a boom in staycations also fuelled the increase in second home purchases."
The region with the highest proportion of second home sales was London, at 29%.
Best areas for buy-to-let in the UK
If you’re thinking of getting a buy-to-let property you’ll want to know the areas in the country with the highest rental yields. Rising interest rates and falling property prices suggest that the outlook for buy-to-let investors is deteriorating. However, while some home buyers might be reconsidering their options, the fundamentals underpinning the buy-to-let market for investors remain robust.
According to Zoopla’s latest Rental Market Report, rents grew 12% last year, with the average rent for new lets reaching £1,078 a month. Zoopla expects rental growth to slow to 5% this year, but the supply and demand imbalance that has been an issue for years is unlikely to be resolved any time soon.
Indeed, so attractive is buy-to-let that the number of homes sold to buy-to-let investors as a percentage of all homes sold is at its highest for six years, says This Is Money, quoting research from estate agent Hamptons. Around 12.2% of all homes sold last year were to buy-to-let investors, up from 11.7% in 2021.
Still, the figure remains below the peak of 15.5% recorded in 2015 – just before then-chancellor George Osborne introduced reforms to increase taxes in the sector – a 3% stamp duty surcharge and a reduction in tax relief on mortgage interest. Like all investments, if you’re thinking about getting into buy-to-let, you need to think carefully about what you can afford and consider the potential returns available from different properties and different regions. We look at the best areas for buy-to-let investing in the UK.
The 10 best cities for buy-to-let investing
Aldermore Bank’s Buy to Let City Tracker ranks cities in the UK based on five different factors: average total rent, the best short-term returns through yield, long-term return through house price growth over the past ten years, the lowest number of vacancies as a proportion of total housing stock and the percentage of the city population in the rental market. Based on these factors, the best cities for landlords to invest in 2023 are Manchester, London, Bristol, Cambridge and Peterborough.
The average property price in Manchester has risen by 5.6% since 2010, standing at £247,341, while the rental yield is 5.5%. Additionally, 31% of the city’s residents rent privately, and at £454 the average rent per room is high compared to other cities in the north of England. London rose to the second spot on the list from the sixth last year. At £660 it offers the highest average room rent for all cities, but the yield is low comparatively at 5.1%.
Bristol’s average rent per room is £519, and the city offers a yield of 4.4%, while the average annual increase in house price is 5.7%. In Cambridge, the average rent for a room is £552. The average house price in the city is £533,192 with an annual price increase of 5.6%, while the rental yield is 3.1%.
Peterborough jumped 11 places to 5th place, with property price growth rising from 3.86% to 5.2% from 2021 to 2022. The city offers a rental yield of 6.1%. “Year on year, we’ve seen the cities offering the best investment for landlords shift consistently,” says Jon Cooper, head of mortgages at Aldermore. This highlights how landlords really have to be on top of their game to ensure they maximise their investment, looking for areas that offer value not only for the short term but for the longer term too. The mortgage industry has experienced a series of testing events with interest rates hikes, uncertainty in the UK economy, as well as stamp duty shifts and looming Energy Performance Certificate changes; factors that are not only affecting landlords but also their tenants, putting both groups under pressure. We encourage landlords to work together with their brokers, reviewing their portfolios to ensure they’re future-proofed for further shocks that may lie ahead.”
|
Rank |
City |
Average rental yield |
Average rent per room pcm |
|
1 |
Manchester |
5.5% |
£454 |
|
2 |
London |
5.1% |
£660 |
|
3 |
Bristol |
4.4% |
£519 |
|
4 |
Cambridge |
3.1% |
£552 |
|
5 |
Peterborough |
6.1% |
£443 |
|
6 |
Milton Keynes |
5.2% |
£512 |
|
7 |
Luton |
4.9% |
£445 |
|
8 |
Reading |
4.6% |
£538 |
|
9 |
Southend |
4.0% |
£472 |
|
10 |
Coventry |
6.0% |
£424 |